
Customer Segmentation with RFM Analysis
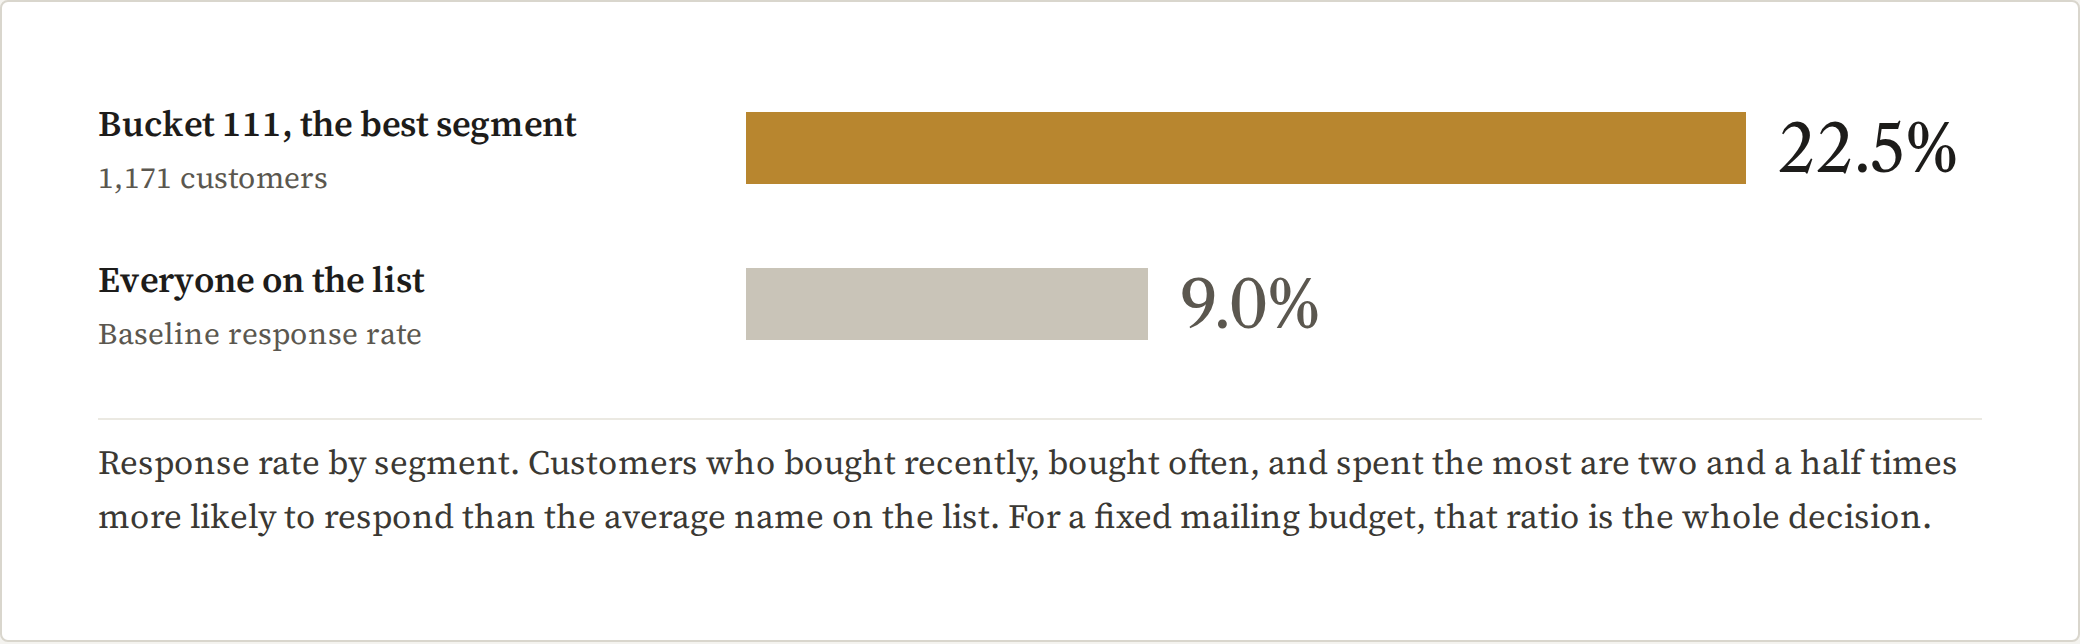
A book retailer was mailing its whole customer list and getting a 9% response. I scored every customer on recency, frequency, and spend to find the segment worth mailing, and the top one responded at two and a half times that rate.
MARKETING ANALYTICS
Context
MGTA 403, UCSD Rady MSBA
My Role
Solo project, built end to end
Tools
Python, pandas, pyrsm
Timeline
Summer 2026
2.5X
Key Finding
The best RFM segment responded at 22.5% against a 9.0% baseline. Mailing those 1,171 customers instead of the whole list is the difference between a campaign that pays for itself and one that doesn't.
the question
Direct mail costs the same per customer whether or not they buy. BookBinders was sending to everyone at a 9% response rate. If some customers are far more likely to buy than others, which ones are they, and can we identify them from purchase history alone?
The Data
The BookBinders customer database, with each customer's months since last purchase, total number of purchases, and total amount spent, plus whether they responded to the campaign.
How RFM Scoring Works
Every customer is sorted into five equal groups on each of three measures, then the three scores are joined into one bucket code. A customer in bucket 111 is in the best fifth on all three.
R
Recency
How long since they last bought. Bin 1 is the most recent fifth of customers.
M
Frequency
How many times they've bought. Bin 1 is the most frequent fifth.
What i found
F
Monetary
How much they've spent in total. Bin 1 is the highest-spending fifth.
The catch
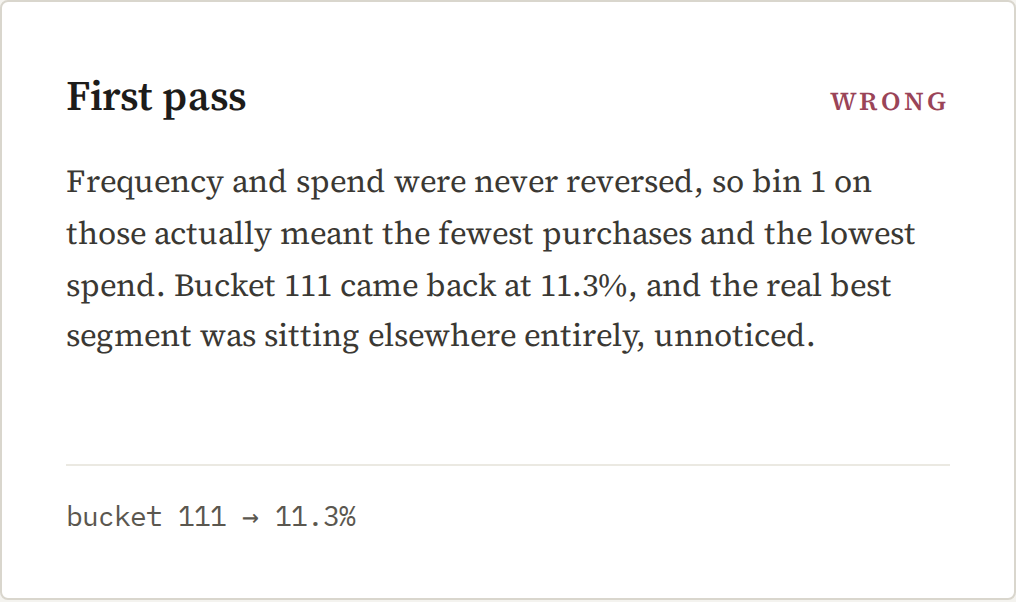
Recency runs backwards from the other two: a smaller number is better, while for frequency and spend a bigger number is better. Both of those have to be reversed so that bin 1 means "best" on all three. Miss it and the whole analysis points at the wrong customers.
What I learned
A result that looks reasonable is not the same as a result that is right. Both versions of this analysis produced tidy percentages, and only one of them pointed at the correct customers. Writing down the convention and testing it against a known answer is what separated them.
The check
I built two fake customers with known answers: an ideal one who should land in 111 and a worthless one who should land in 555. Running them through the bins is what proves the scoring is oriented correctly, and it's the step that would have caught the first version immediately.
Catching a Wrong Answer
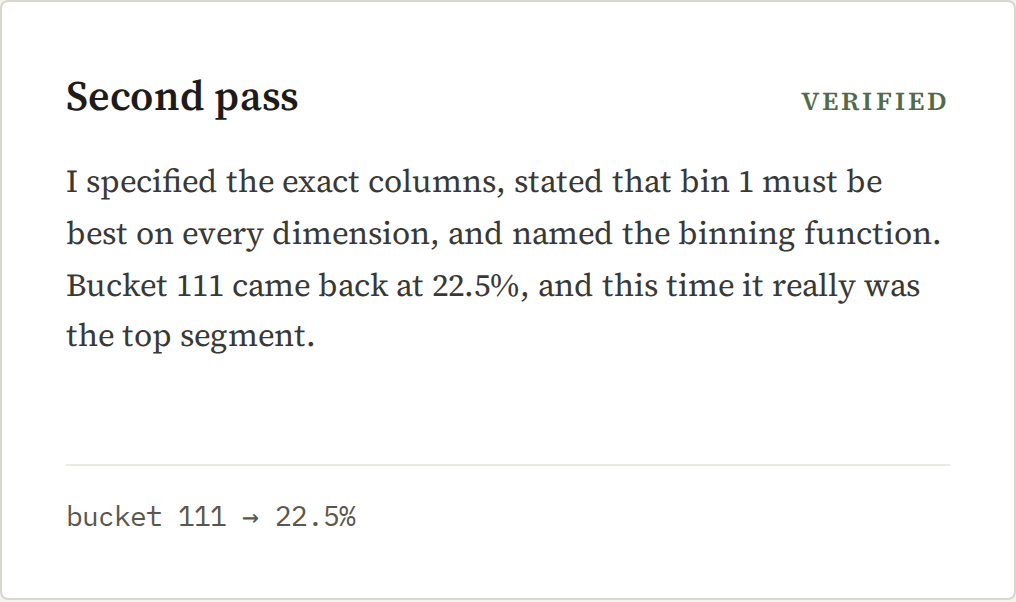
I ran the analysis twice: once from a loose one-line brief, and once from a written specification. The first version produced a clean, confident, wrong answer.
Recommendation
Stop mailing the full list. Target the top RFM buckets first, and use the gap between segment response rates to set how deep into the list the budget should go. The same scoring can be rebuilt each cycle as customers move between bins.