
DATA ENGINEERING & SQL
Building a Data Pipeline in Snowflake
5
sources in 5 formats, joined in one warehouse
2,072
supplier invoices matched to purchase orders
$2.87M
billed above the value of goods received
Purchase Orders
One file per month, 8,367 line items total. Each row is one product on one order.
PurchaseOrderID
SupplierID
41 CSV files
OrderDate
OrderedOuters
ReceivedOuters
ExpectedUnitPricePerOuter
Suppliers
13 suppliers in a separate database, with names, zip codes, and payment terms.
ID Supplier Zip Pays in
Postgresql Table
1 A Datum Corporation 22202 14 days
2 Contoso, Ltd. 80125 7 days
4 Fabrikam, Inc. 95642 30 days
The DatA
The data came from five places in five formats, none of which lined up. Here's what I was working with.
Supplier Transactions
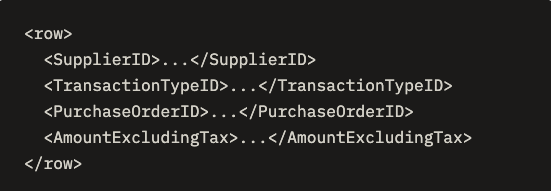
2,438 nested records mixing two things: 2,072 invoices and 366 payments.
1 XML file
Location + Weather
A Census file with coordinates for 33,791 zip codes, plus NOAA daily weather from Snowflake Marketplace.
ZipCode
StationID
Latitude
TSV + Marketplace
Longitude
MaxTemperature
Date
what i did
01
Automated the load
A Python loop staged all 41 monthly files into year and month folders, then one COPY INTO cast every column on the way in.
02
Rolled line items up to orders
Valued each order by what was actually received, not what was ordered. That gap is the whole point of the analysis.
03
Shredded the XML
Loaded the XML raw, then pulled each field into its own column so SQL could query it.
04
Matched orders to invoices
Joined each invoice to its order total. A positive difference means the supplier billed more than what arrived.
05
Moved Postgres data without Python
Exported the supplier table straight to a file for Snowflake. I also wrote a function that reads any CSV and generates its CREATE TABLE automatically.
06
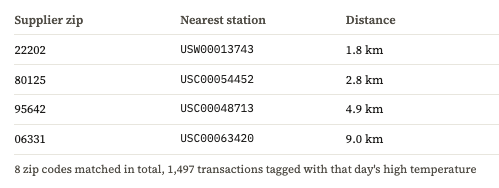
Found each supplier's nearest weather station
Used HAVERSINE distance to rank nearby stations for every supplier zip code, then kept the closest one that actually reported temperatures.
for f in sorted(glob.glob("data/Monthly PO Data/*.csv")):
year, month = re.match(r"(\d{4})-(\d{1,2})", ...).groups() cs.execute(f"PUT 'file://{f}' "
f"@PURCHASES_STAGE/{year}/{month.zfill(2)}/")
# 41 files staged, 8,367 rows loaded
SELECT PurchaseOrderID, SupplierID, OrderDate,
SUM(ReceivedOuters * ExpectedUnitPricePerOuter) AS POAmount
FROM PURCHASES
GROUP BY PurchaseOrderID, SupplierID, OrderDate
-- 2,074 orders, $941.5M in goods received
SELECT
TRY_TO_NUMBER(XMLGET(doc, 'SupplierID'):"$"::VARCHAR) AS SupplierID, TRY_TO_NUMBER(XMLGET(doc, 'PurchaseOrderID'):"$"::VARCHAR) AS PurchaseOrderID, TRY_TO_NUMBER(XMLGET(doc, 'AmountExcludingTax'):"$"::VARCHAR, 18, 2)
FROM SUPPLIER_TRANSACTIONS_RAW
-- 2,072 invoices, 366 payments
SELECT t.PurchaseOrderID, t.SupplierID,
t.AmountExcludingTax, o.POAmount,
t.AmountExcludingTax - o.POAmount AS invoiced_vs_quoted
FROM SUPPLIER_TRANSACTIONS t
JOIN PURCHASE_ORDER_TOTALS o
ON t.PurchaseOrderID = o.PurchaseOrderID
def create_table_sql(csv_path, table_name, sample_rows=200):
"""Read a CSV header, sample its rows, and return a CREATE TABLE with a type per column.""" ...
cs.execute(create_table_sql("supplier_case.csv", "SUPPLIERS")) # 13 suppliers loaded
A date that doesn't exist
Some rows said 2/29/2022, but 2022 wasn't a leap year. I used TRY_TO_DATE so the load flagged them instead of crashing.
Data Traps I Caught
A zip code missing a digit
One supplier's zip was stored as 4 characters. Padding it back to 5 kept that supplier from silently dropping out of the join.
What i found
Double counting
Joining invoices to line items would count every difference several times. Joining to order totals keeps it one row per invoice.
184 days
passed with no purchase orders at all, found by generating a full calendar and checking for gaps.
What I Learned
Most of the work in analytics happens before the analysis. Every trap above would have produced a clean-looking but wrong number. Checking the grain of each table before joining, and handling bad values instead of ignoring them, is what made the final $2.87M trustworthy.
$2.87M
was billed above the value of goods actually received, across 2,072 invoices. That's money the company could recover or stop paying just by checking invoices against deliveries.
6 of 13
suppliers on file never appeared on a single purchase order.
71.72%
of all received value came from a single supplier, a big concentration risk.